
Industry survey
Manufacturing wage survey
Benchmark production, skilled trades, and supervisory pay across your member plants, without any of them seeing another plant’s numbers.
What a manufacturing wage survey has to get right
A manufacturing wage survey collects pay and benefits data from plants in a defined region so each participant can see where its rates sit against the local market. Some sponsors call it a manufacturing salary survey when office and supervisory roles are in scope; the instrument is the same. The buyer is usually a county economic development authority or a manufacturers association running it on behalf of members.
Manufacturing breaks most generic survey tools for one reason: base rate is not the number that decides anything. Two plants can post the same hourly rate and pay very differently once shift premium, scheduled overtime, and attendance or safety bonuses land. If your instrument collects a single wage figure, you have published a number that no plant manager can act on.
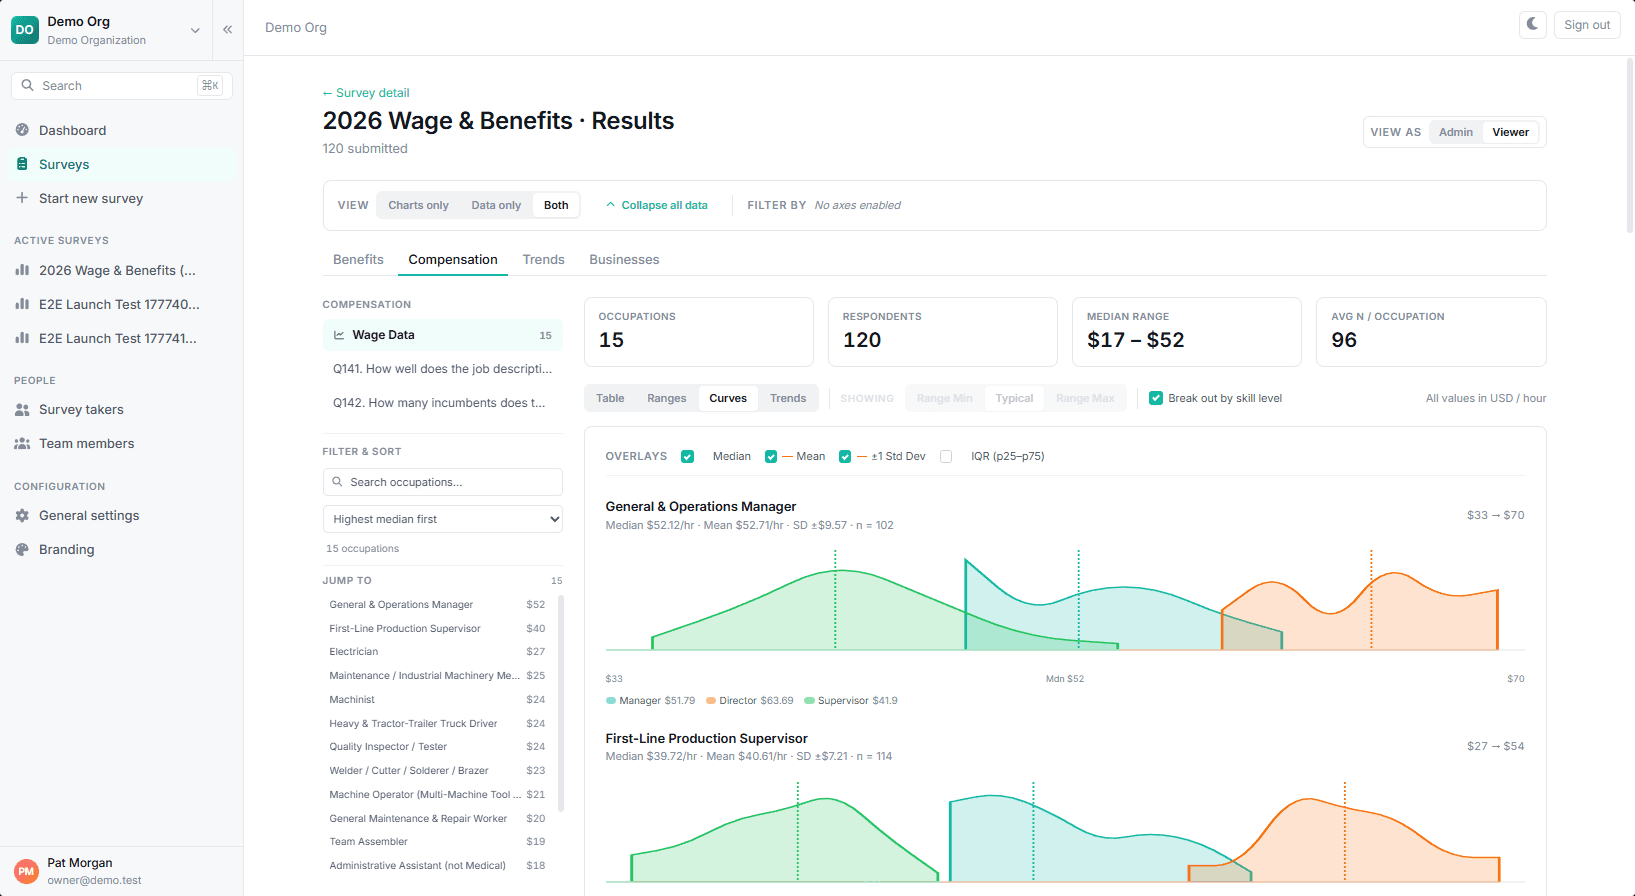
What it measures
Inside a manufacturing wage survey
Occupations, on SOC codes
The full SOC catalog is available; these are the codes a manufacturing survey leans on hardest: production and assembly (51-2000), maintenance and repair (49-9041), CNC and machine tool (51-4011), quality inspectors (51-9061), first-line supervisors (51-1011), and industrial production managers (11-3051). Standard codes are what make this year comparable to last year.
- Prebuilt trade and production career ladders
- Custom roles where a plant has no clean SOC match
- Hourly and annual units tracked per role
The full cash picture
Base rate is one column. The survey separates shift differential, scheduled and unscheduled overtime, and incentive pay so a reader can compare like with like instead of guessing what is inside a number.
- Base, other cash, and total cash split per role
- Shift premium by shift pattern
- Attendance, safety, and production bonuses
Benefits and retention
The 174-question benefits template covers medical, retirement, PTO, and leave, and you can extend it with the items that decide manufacturing retention specifically.
- Employer contribution by plan tier
- Apprenticeship and tuition support
- Turnover, average tenure, and fill difficulty per occupation

Why national manufacturing data misses
Manufacturing labor markets are unusually local. A plant does not lose a maintenance technician to the national average, it loses them to the plant twenty minutes down the road that pays a better second-shift premium. Skilled trades in particular clear at a regional rate set by whichever employers are hiring that quarter.
That is why a county or multi-county survey outperforms a national dataset here even though the national dataset is larger. You are not trying to describe manufacturing. You are trying to describe the twenty employers competing for the same welders.
Confidentiality
The small-cohort problem, and how the platform handles it
Manufacturing surveys run into confidentiality faster than most. A county may have only a handful of plants above a given headcount, and everyone in the room knows who the big employer is. Publish a county median for a role that three plants staff and you have effectively published one plant’s payroll.
Suppression cannot be an afterthought here, because if participants believe their numbers are traceable they either decline or shade their answers, and the survey quietly becomes worthless.
- Automatic low-count suppression. Any question answered by fewer than N distinct businesses is redacted. N defaults to 5 and you set it per survey.
- Per-occupation cell protection. Even when a question clears the threshold overall, an individual occupation reported by too few plants is hidden on its own.
- Suppression follows every filter. Slice the results any way you like: anything below the Safe Harbor threshold is suppressed in the filtered view too, so no combination of filters can expose a single employer.
- Admin versus audience views. Your team reviews complete data internally while every participant-facing view is protected, and you can preview exactly what each audience sees.
How to run one
The full methodology lives in our complete wage and benefits survey guide. These are the steps that differ for this industry.
Step 1
Map plant titles to SOC codes first
Plant job titles drift more than most. Machine operator at one facility is a setup technician at the next. Map to SOC codes before you field anything, or you will publish averages that blend two different jobs.
Step 2
Ask shift structure before shift premium
You cannot interpret a differential without knowing the pattern it applies to. Capture whether the plant runs eight-hour rotating, twelve-hour fixed, or a Dupont schedule, then ask what each shift pays.
Step 3
Recruit through the association, not cold
Manufacturing participation runs on peer trust. Recruitment through a county EDA or a manufacturers association materially outperforms outreach from an unfamiliar vendor, because the ask arrives from an organization the plant already belongs to.
Step 4
Set the suppression threshold with the cohort in mind
A five-business floor behaves very differently in a county with eight plants than in one with eighty. Set the threshold deliberately at the start, and tell participants what it is. That disclosure is often what gets the survey filled out.
Common questions
How many plants do we need for the results to be usable?
Enough that your suppression threshold does not blank out the roles people care about. The practical test is not a single headcount target, it is whether your most-requested occupations clear the floor. As part of a planning add-on or a Done-For-You engagement, we can talk through which roles are likely to clear Safe Harbor before you field.
Will competitors see our individual plant data?
No. Participants and subscribers see aggregated, safe-harbored results only. Any slice with too few responding businesses is redacted automatically, and individual occupations are protected separately from the question as a whole.
Can we compare this year to last year if we ran a survey before?
Yes, and it is worth doing. We can migrate prior cycles, quoted up front by how many cycles and what shape the data is in, then link this year’s survey to last year’s and match returning respondents so their prior answers pre-fill. They review and update instead of starting over, which is the single biggest lever on response rate in a repeat survey.
Do you handle the survey design, or just the software?
Both are available. On the self-serve license you design the instrument yourself from the templates and the in-app guidance. Dr. Michelle Cobb’s full instrument and methodology review is a paid add-on starting at $1,500 per survey, and comes included with Done-For-You. See pricing for how the two tiers work.
Keep reading
How to run a wage and benefits survey
The complete methodology: what good survey data has to deliver, how to write comparable questions, and how to publish results that hold up.
Salary benchmarking template
The wage grid structure, occupation down the rows and career level across, with percentile bands in each cell.
Surveys for economic developers
How county EDAs run these programs as a public resource, a paid report, or a paid membership.
Complex surveys to send and don’t know where to start?
Book a 20-minute demo. We’ll show you the system, talk through your goals, and tell you whether we’re a fit. No pressure.