
Free template
Salary benchmarking template
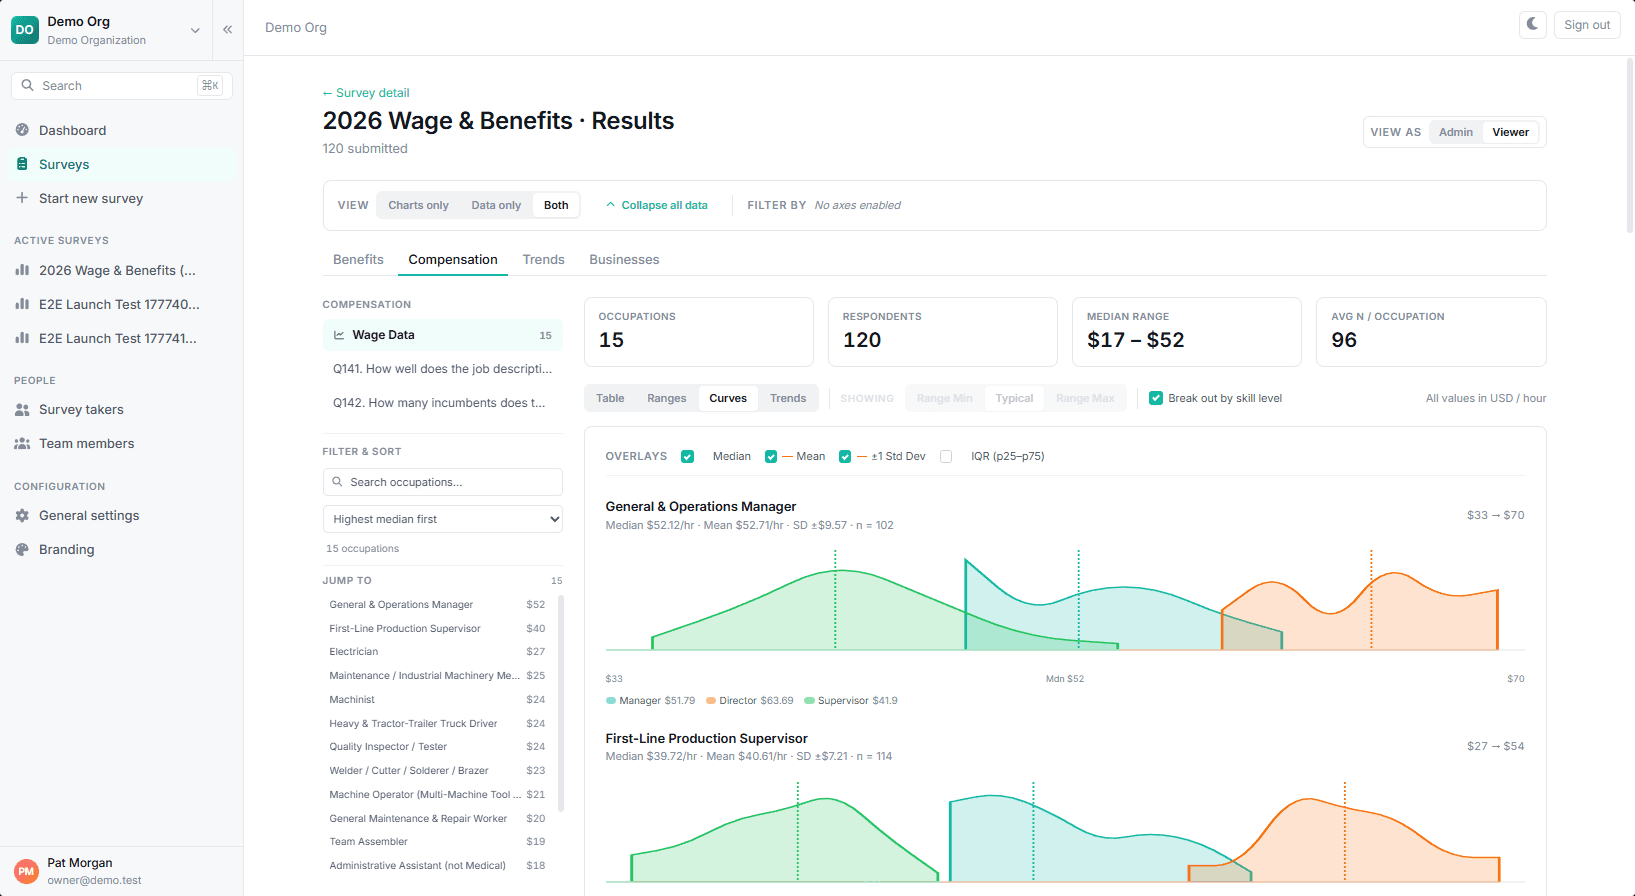
The wage grid: occupation down the rows, career level across the columns, percentile bands in every cell.
Why the grid is shaped this way
Entry, mid, and senior pay for the same job are effectively different benchmarks. A template that gives each occupation a single row produces an average that describes nobody, which is the most common structural flaw in a homemade salary survey.
This template puts occupation on one axis and career level on the other, so every cell holds a genuine comparison. Each cell reports a band rather than a point, because almost every job pays across a range and the width of that range is often the more useful fact.
Inside the template
- SOC-coded occupation rows. Standard Occupational Classification codes so your data stays comparable across years and against public sources.
- Career-level columns. Prebuilt ladders for trade, professional, administrative, production, management, and executive tracks.
- Percentile bands per cell. 10th, 25th, 50th, 75th, and 90th, plus mean and response count so a reader can judge how much weight a cell carries.
- Hourly and annual handling. Rate unit tracked per role, so hourly and salaried jobs sit in one grid without distorting each other.
- Total cash breakout. Base, other cash, and total cash as separate columns, so nobody has to guess what is inside a number.
- A response-count column. The single most-skipped field in homemade grids, and the one that tells you which cells to trust.
Get the salary benchmarking template
Tell us where to send it. The grid arrives by email, PDF attached, usually within a few minutes. No sales call attached.
Using the grid without misreading it
Step 1
Match jobs on content before you fill anything in
Titles drift between employers. Map each job to a SOC code based on what the work actually is, otherwise the grid is precise about the wrong thing.
Step 2
Read the response count before the percentile
A 90th percentile computed from four responses is not a market signal. Check how many employers stand behind a cell before you quote it.
Step 3
Pick a target percentile deliberately
The median is a default, not an answer. Decide where you intend to sit for each job family and why, then measure against that rather than drifting toward whatever the data shows.
Step 4
Date the grid
Write the effective date on it. Compensation data ages from the moment it is collected, and a grid without a date will eventually be quoted as if it were current.
Keep reading
How to run a wage and benefits survey
The complete methodology, including job matching, market cuts, and what good survey data has to deliver.
Reading your survey results
How to structure the report and read percentiles honestly once the grid is populated.
Benefits survey questions
The other half of the picture: what to ask about benefits and how to word it.
Complex surveys to send and don’t know where to start?
Book a 20-minute demo. We’ll show you the system, talk through your goals, and tell you whether we’re a fit. No pressure.