
Compensation benchmarks HR teams can defend
The benchmarks every comp review and benefits committee depends on, built for HR leaders who need numbers that hold up in the room.
Why HR teams use Sensible Surveys
Comparable Data You Can Defend
HR leaders are asked to defend compensation decisions to executives, boards, and employees. Generic salary benchmarking data is expensive and rarely matches the cohort you actually compete with for talent. A study run on Sensible Surveys grounds compensation and benefits benchmarking in local numbers your stakeholders can defend, with pay benchmarking by occupation rather than a single blended average.
Running a study across an association’s membership instead? The associations page covers that model in full.
The Compensation Benchmarking Process
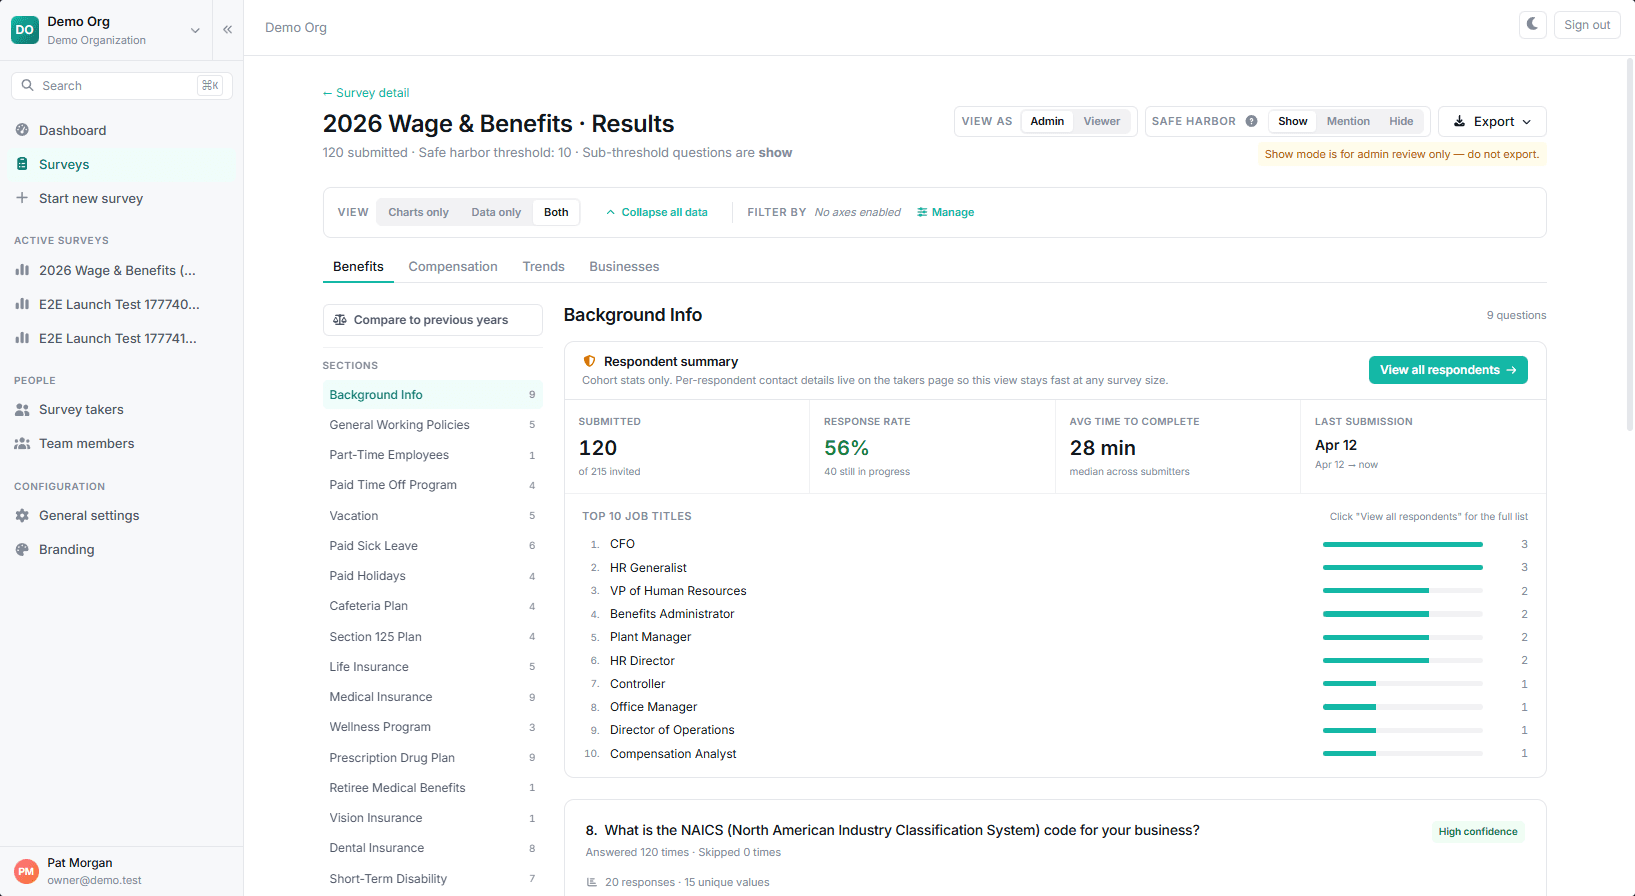
A compensation benchmarking process is only as good as its inputs: which roles, which cohort, which questions. Before you launch, we can work with you to understand the decisions the data needs to support. Most teams start their wage & benefit survey from the benefits template and adjust from there: we can recommend edits, adjust branching logic, and align the structure with any prior survey so your data stays comparable year over year.
From there the flow is scoping, roster, fielding, and release: load the employer or business-unit roster, field with automatic reminders while you watch response rates live, and let results compile the moment the survey closes, into an internal view and a Safe Harbor protected view you release on your schedule.

What you get
The Sensible Surveys Platform
A year of access to our fully-featured platform with up to three surveys included. Build, launch, remind, and analyze. Engage us to run the study end-to-end or run it yourself.
Advanced Benefits Survey Template
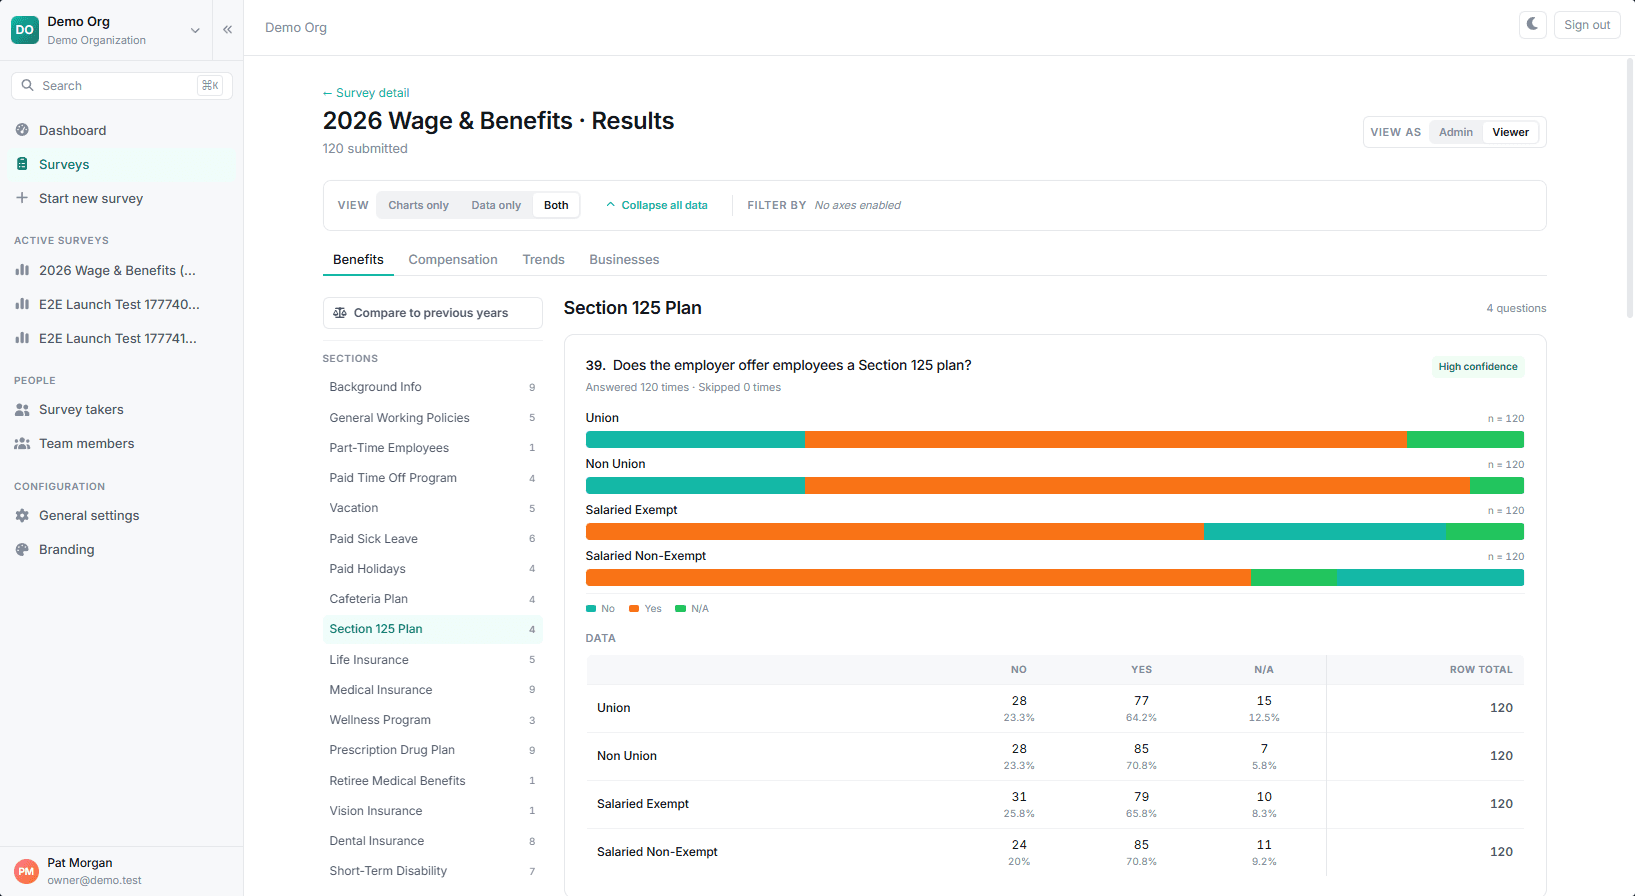
The default benefits template covers every aspect necessary at industry and enterprise levels: PTO, insurance, retirement, wellness, leave, and more. 174 questions you can edit, remove, or extend.
Compensation Module
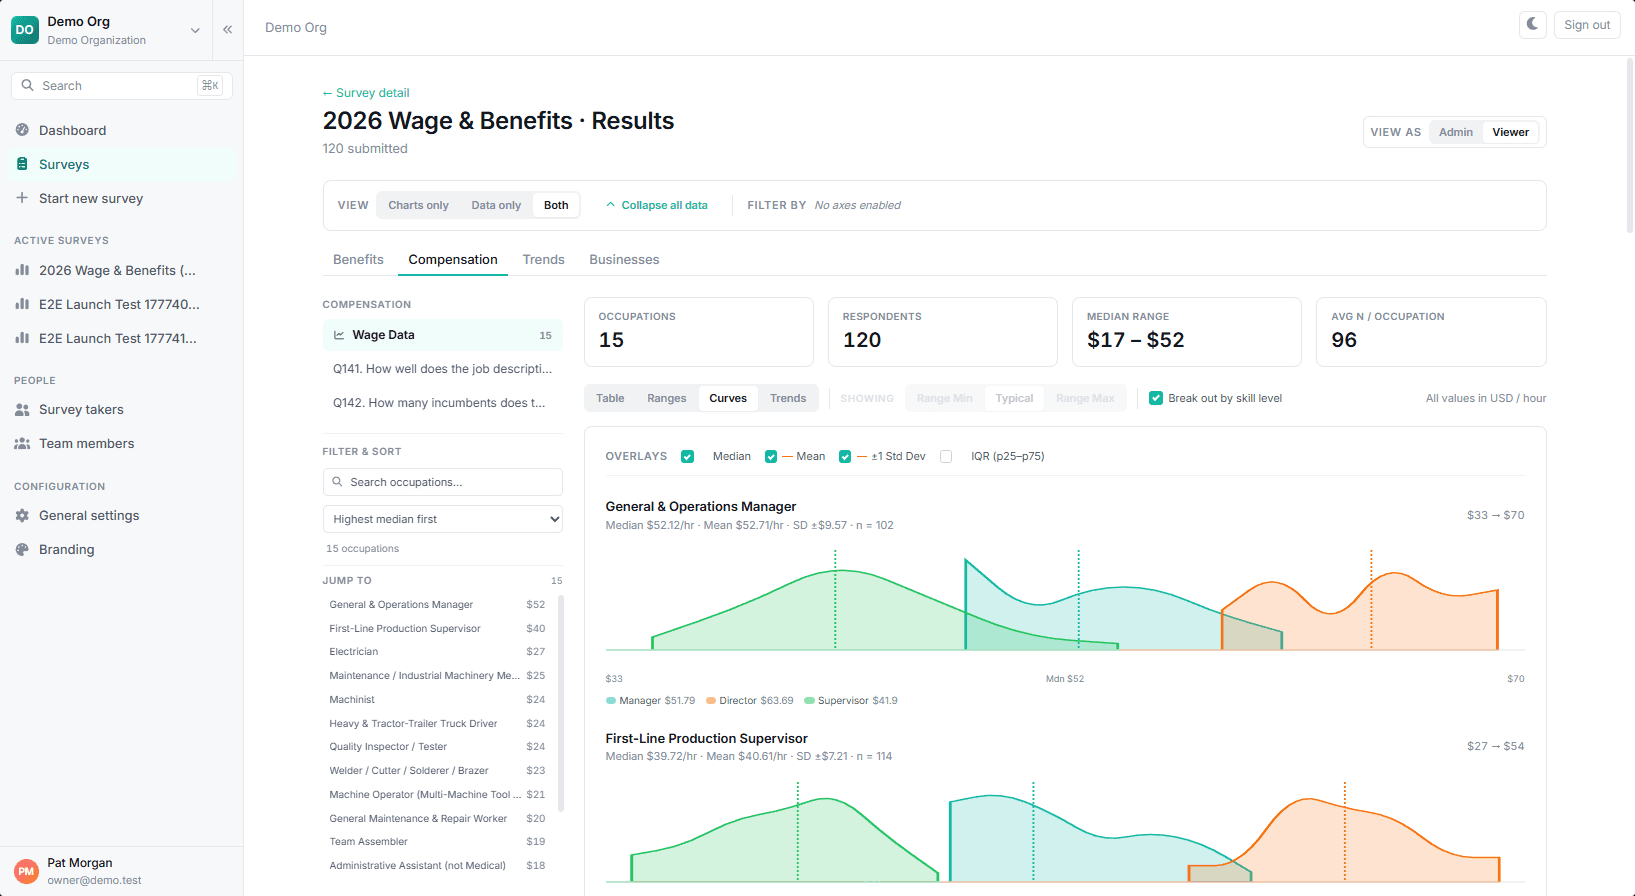
Pay percentiles by SOC code, filterable by industry, company size, employee type, shift type, and career path. Anonymized via Safe Harbor for participant-facing reports.
Templates and guides
The instruments we use with clients, free to download and adapt.
Salary benchmarking template
The wage grid: occupation by career level, with percentile bands and a response count in every cell.
Benefits survey questions
The categories worth covering and how to word them, drawn from our 174-question template.
How to run a wage and benefits survey
The complete methodology, from instrument design through publishing results that hold up.
Executive compensation survey
Benchmarking C-suite and board pay against a named peer group, with total compensation unbundled.
Participant Assistance
Whether your participants are your own business units or the peer employers in your study, our team can help every step of the way so completion rates stay high.

Intro & Follow-up Phone Calls
US-based, full-time staff make calls to establish trust, help participants complete surveys, and explain the value of participation.

Welcome & Follow-up Emails
Personalized, automatic emails inform participants where they are in the process and remind them as deadlines approach.

Video Calls
We jump on video calls with participants to help them get logged in and answer questions about how best to report their company’s situation.
Safe Harbor by Default
Participant-facing results run through Safe Harbor anonymization. Whenever a slice has too few respondents to protect identities, the underlying numbers are hidden, so no participant can be reverse-engineered out of a benchmark.
Support When & How You Need It
Whether you need a quick answer or end-to-end help running a survey, we’re available by phone, email, and video M–F, 9am – 5pm Eastern.
HR Team FAQs
How do we defend compensation decisions to the board?
With data from a cohort the board recognizes. A board that shrugs at a national percentile pays attention when the benchmark comes from the employers you actually lose candidates to, collected this cycle, with the methodology written down. That is what a peer-set salary benchmarking survey gives you: a number, its source, and the process behind it, all in one place.
Can we benchmark against national averages too?
Sensible Surveys produces local and peer-set data. National surveys can’t give you that. We don’t pull from BLS or external sources, but most teams use the two together: national for context, your survey for the cohort you actually compete with for talent.
How is this different from a consultant-led salary survey?
A consultant delivers one report. You produce a living dataset. The cost is dramatically lower, you can rerun the same study each year, and participants’ prior answers pre-fill the next cycle so annual updates take them a fraction of the time.
How many companies do we need in our peer set?
Fewer than you might think, and how finely you slice matters more than the raw count. A broad benchmark needs fewer employers than one filtered by size, industry, and shift all at once. The platform is honest about this by construction: Safe Harbor suppression hides any slice with too few respondents rather than showing a misleading number. And once a peer set exists, year-over-year prefill keeps it intact, because returning employers are far easier to keep than new ones are to recruit.
How is data anonymized when our cohort is small?
Results are anonymized under Safe Harbor rules: any slice with too few respondents is hidden rather than shown, so no individual company can be re-identified from a benchmark.
Can admins see individual company submissions?
Designated admins can if you enable it. Participant-facing views always show aggregates only. No individual company is ever exposed to peers, site selectors, or third parties.
Complex surveys to send and don’t know where to start?
Book a 20-minute demo. We’ll show you the system, talk through your goals, and tell you whether we’re a fit. No pressure.