Skip to content
Sensible Surveys

Easily create & manage robust surveys.

Create robust, multi-page surveys and automatically compile data into a single results dashboard you can distribute to survey takers or use to gather insights and make decisions.

Three tools your team uses every week

Build, distribute, and analyze in one place.

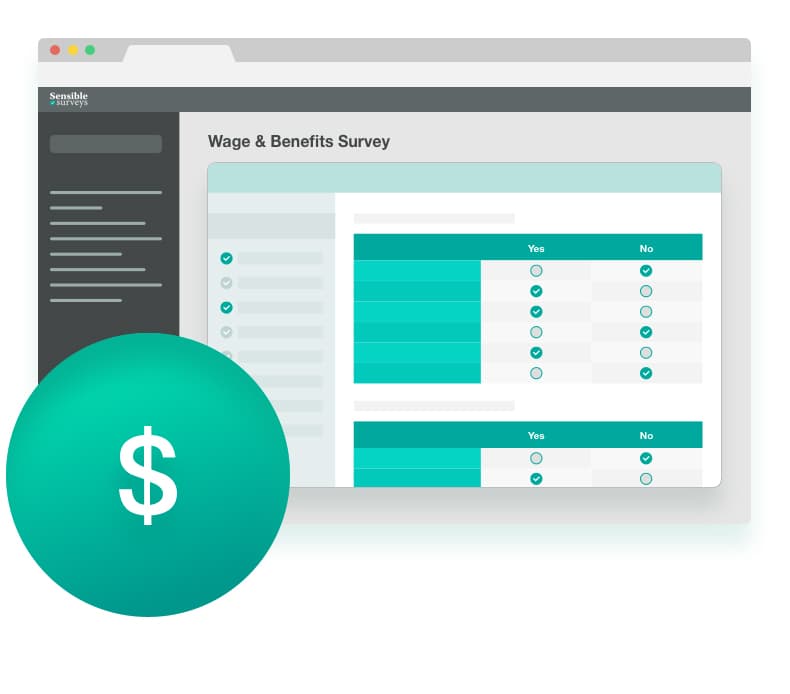
Build & launch: edit any question, matrix, or branching rule.
Track invited participants, response rates, and progress.
Compensation curves by occupation with statistical overlays.

Build & launch

Simple To Start, Intuitive To Take, & Results Compiled Automatically

  • Robust intuitive survey builder

    Higher completion rates

    Survey takers move quickly through questions because the interface gets out of the way. 14 question types, branching logic, automatic graphs, and a UX designed for non-technical participants, so more people finish, and your dataset is bigger.

  • Editable survey templates

    Launch in days, not months

    Skip the consultant. Choose a Ph.D.-prepared template, confirm it covers your needs, invite users, and go. Your team owns the survey end-to-end without a vendor in the loop.

  • User management

    Manage participants without a spreadsheet

    Track every invited participant, send automatic reminders, and bulk-upload entire lists. Stop maintaining a side spreadsheet of "who has and hasn't finished".

    • Track invited survey takers’ progress
    • Automatic reminders if not completed on time
    • Bulk-upload survey takers
    • Add or remove people easily
    • Reset passwords
    • View individual or compiled answers

Analyze & distribute

  • Analyze complex data

    Analyze Complex Data

    Filter, sort, and search. View top, middle, and bottom percentiles. Anonymize using Safe Harbor policies. Export to Excel or CSV.

    • Filter, sort, and search
    • View top, middle, and bottom percentiles
    • Enable graphs and charts
    • Compile data per survey or across a time period

    • Anonymize via Safe Harbor
    • Export to Excel or CSV
  • Manage simultaneous surveys

    Manage Simultaneous Surveys

    Run as many surveys as you want, tag users, set start and end dates, and pause or extend whenever you need to.
  • Distribute results dashboard

    Distribute Results

    Web-based analytics tool compiles results and does the analysis for you. Charts and graphs make data comprehension easy.

The full feature list

All 78 platform capabilities in one place, grouped by area. Expand a group to see everything in it.

  • Build surveys fast · 8 features
    Template libraryStart from ready-made survey templates, global or your own, or build from scratch. Save any survey as a reusable template.
    12 question typesShort text, long text, number, single choice, multiple choice, dropdown, four matrix types (radio, checkbox, number, percentage), matrix dropdown, and a dedicated compensation panel.
    Smart SuggestType a question and the builder infers the right answer type, seeding options, help text, and matrix rows and columns automatically, with a "why this type" explanation.
    Conditional logicShow or hide questions based on prior answers, with AND/OR rules, matrix wildcards, a visual logic graph, and a raw-expression escape hatch.
    Live preview & preview-as-viewerSee the survey render as you edit, and preview results exactly as a taker, viewer, or subscriber will see them, including confidentiality redaction.
    Customize per survey, safelyInclude or exclude sections and questions for one survey without altering the shared template.
    Power toolsUndo/redo, find and replace, question snippets, bulk table edit, drag-to-reorder sections, an outline minimap, publish preflight checks, and keyboard shortcuts.
    Import from Excel / SurveyMonkeyBring an existing survey and its historical responses in from a spreadsheet export, with automatic question-type classification and a human review queue before anything commits.
  • Compensation & benefits data, done right · 7 features
    Occupation-by-level wage gridsCollect pay ranges per occupation and career level, the way compensation surveys actually work.
    BLS occupation pickerChoose from standard SOC occupations, searchable by title or code, add custom roles, or enter free-form occupations.
    Career-level templatesPrebuilt level ladders for trade, professional, administrative, production, management, and executive roles.
    Hourly & annual rate unitsRespondents enter wages in their natural unit; the platform tracks the unit per role and reports hourly and annual figures without distorting the data.
    Rich statistics10th/25th/50th/75th/90th percentiles, mean, median, min/max, standard deviation, and bell-curve distribution buckets.
    Total-compensation breakdownBase salary, other cash, and total cash split out per role.
    Extra role dataOptionally capture headcount, average tenure, shift differential, turnover, and fill difficulty per occupation.
  • Confidentiality & safe harbor · 7 features
    Automatic low-count suppressionAny question answered by fewer than N distinct businesses (default 5, configurable) is automatically redacted, so no single employer can be identified.
    Per-occupation cell protectionEven when a question clears the threshold overall, any individual occupation reported by too few businesses is independently hidden.
    Re-identification defenseOnly questions you designate as filter axes can be used to slice results, preventing anyone from narrowing a filter down to a single employer.
    Consent-gated open text"Other" free-text answers only appear in results when the respondent agrees to share them.
    Exclude questions or responsesRemove a sensitive question or an outlier response from published results with one click.
    Configurable threshold, per surveySet the safe-harbor minimum that fits your program.
    Admin vs. audience viewsManagers review complete data internally while every external audience automatically gets the protected view, and managers can preview exactly what each audience will see.
  • Invite & manage participants · 8 features
    Bulk invite rosterAdd participants in a structured table, paste directly from a spreadsheet, or upload a CSV with a downloadable template.
    Import roster from a previous surveyReuse last year’s invitee list with a preview and picker.
    Participant deduplicationExisting participants are matched and reused instead of duplicated, with case-insensitive email matching and automatic business de-duplication.
    Cross-account safeguardsAn email already registered to another account is flagged rather than silently attached.
    Successor mappingMatch this year’s respondents to their prior-year records to power trends and answer prefill.
    Invite by email or by linkSend branded email invitations, or generate shareable links for manual outreach.
    Throttled, staggered sendingInvitations fan out at a controlled rate to protect deliverability.
    Resend, re-invite & request-to-joinRe-send to non-responders, and let interested businesses request an invitation.
  • The respondent experience · 9 features
    One-click, passwordless sign-inMagic-link invitations drop respondents straight into their survey; corporate email scanners cannot burn the link before the person clicks.
    Autosave & save-and-exitAnswers save automatically with a live status indicator; leaving flushes any pending save so nothing is lost.
    Section navigator & progressA clear side navigator with per-section answered counts, flexible or enforced ordering, and a configurable progress display.
    Matrix "mark N/A"Respondents can mark a single row, or an entire matrix, as not applicable, satisfying required questions cleanly.
    Guided compensation entryA dedicated multi-step widget: grouped, searchable occupation picker, per-role wage pages, hourly/annual toggle, and a fast roles navigator that scales to thousands of roles.
    Year-over-year prefillReturning respondents see last year’s answers pre-filled to review and update, with a "welcome back" banner.
    Review & submit gateA final summary shows what is complete, in progress, or missing, and only allows submission when all required questions are answered.
    Accessible & responsiveWCAG-AA-minded design, full keyboard navigation, and layouts that work on any device.
    Staff-assisted entryInternal team members can complete or edit a survey on a respondent’s behalf.
  • Notifications & reminders · 8 features
    Invitations & welcome emailsBranded survey invitations and combined welcome-and-invite messages for first-time participants.
    Automated remindersConfigurable nudges to respondents who have not started or finished, "closing soon" reminders, and outstanding-count digests to owners.
    Submission receiptsRespondents get a confirmation the moment they submit.
    Results-ready noticesOwners and submitting respondents are notified automatically when results are compiled and released.
    Weekly running-survey digestA Monday summary of in-flight surveys with CSV attachments.
    Owner activity notificationsSurvey launched, taker submitted, closing soon, closed, results ready, late response, member added, and weekly digest, each individually toggleable.
    Email delivery trackingLive delivery status (sent, delivered, bounced, failed) plus opens and clicks flow back onto respondent rows and the activity feed.
    Trustworthy by designEnumeration-safe flows, per-account branding, timezone-aware dates, and a security receipt whenever a password changes.
  • Results, analytics & auto-reporting · 9 features
    Reports build themselvesWhen a survey closes, results compile automatically into a full internal view and a safe-harbor-protected audience view, then wait on your release.
    Aggregated dashboardsHistograms, stacked bars, matrix heatmaps, and compensation panels, with Charts / Data / Both view modes.
    Compensation panelsMedian wage ranges, respondent counts, percentiles, and per-occupation search and sorting.
    Powerful filteringSlice results by chosen values, AND across questions, OR within a question, and control which questions are filterable.
    Year-over-year trendsMulti-year trend series, compare mode, and deltas by percent, points, or value, sourced from the linked predecessor survey.
    Respondent & business viewsA participating-businesses roster with configurable column visibility, plus searchable open-text responses.
    Cohort summaryInvited, submitted, in-progress, and not-started counts, response rate, submission dates, and top industries and job titles.
    Excel exportA multi-sheet workbook with per-section, per-respondent detail for internal analysis.
    Fast at scaleResults are cached with status-aware freshness so large surveys stay responsive.
  • Control who sees results · 7 features
    Role tiersOwners, managers, internal viewers, external subscribers, and respondents each get exactly the right level of access.
    Per-respondent access grantsGrant results access to specific respondents; optionally restrict results so only granted respondents can view them.
    External subscribersOffer paid results access to non-members, scoped to only the surveys they are granted.
    Scheduled, per-audience releaseRelease results to takers, subscribers, and viewers now or on a future date, and revoke just as easily.
    "Who can see results" consoleOne screen listing every viewer, taker, and subscriber, each with a plain-English explanation of why they can or cannot see results yet.
    Release-gated notificationsAccess-granted emails only send once results are actually available to view.
    Individual releasesTurn access on or off person by person, with a full audit trail of every release action.
  • Accounts, teams & branding · 7 features
    Your own branded spaceEach organization gets its own account with a custom URL for members to sign in and participate.
    Role-aware dashboardsA live operations home with an active-survey hero, response-rate and health scoring, a needs-attention feed, and a merged activity stream.
    Owner onboarding checklistGuided setup for org details, contact info, timezone, team, and branding.
    Team managementInvite and manage admins, owners, members, and survey-takers, with role-escalation safeguards.
    Branding (beta)Add your logo and brand colors to respondent-facing and email surfaces.
    Account settingsOrganization details, timezone, and granular per-event email notification preferences.
    Platform administrationA cross-account overview and a create-account flow for onboarding new organizations.
  • Security, reliability & administration · 8 features
    Hard multi-tenant isolationEvery request is scoped to its account; cross-account data access is structurally impossible.
    Full audit trailEvery survey and account change is stamped with who and when, and each survey carries a complete lifecycle timeline.
    Abuse protectionRate limiting on sign-in, password reset, email change, and bulk grants; staggered invitation sending; enumeration-safe authentication.
    Secure account flowsCurrent-password re-verification on change, signed multi-step email changes, security-receipt emails, and account suspension controls.
    Injection & spoofing guardsSender addresses restricted to your own domain, uploaded logos sanitized, and all dynamic content whitelisted.
    Hardened hostingStrict Content-Security-Policy and standard security headers, with locked-down file access.
    Always-fresh appOpen browser tabs detect a new release and seamlessly reload on the next navigation, never mid-answer.
    Operational monitoringHealth checks for uptime monitoring and automated error-log alerting to the ops team.

Feature questions

  • How long does setup take?

    Most teams are sending their first survey within a week. If you’re using a pre-built template, you can launch the same day. The longer poles are usually the planning meetings and participant list, not the software.

  • Can I edit pre-built templates?

    Yes. Add, remove, or rewrite questions; change the branching logic; reorder sections. The pre-built version is a starting point, not a fixed template.

  • Can survey takers see the results?

    Yes, by your choice. You can give participants access to the compiled, anonymized analytics, which is a strong incentive for them to complete the survey. Or keep results private.

  • Can I export to Excel?

    Yes. Excel and CSV exports for individual responses or compiled analytics. Survey takers can also export their own data if you grant them access.

  • Is the data anonymized?

    Yes. The platform implements Safe Harbor anonymization for compiled analytics. Identifying details are stripped before any participant or third party sees the rolled-up results. Raw responses are still accessible to your admins.

Complex surveys to send and don’t know where to start?

Book a 20-minute demo. We’ll show you the system, talk through your goals, and tell you whether we’re a fit. No pressure.